Introduction
The Solution for Better BISage Enterprise Intelligence
Serving as a central hub for all data sources, SEI simplifies the process of accessing and collecting information, then turns that information into actionable insights for smarter business decisions. The Universal CRM Data Model presented throughout this document demonstrates the power of having access to well over 30 KPIs that follow CRM reporting standards. Whether you use the predefined dashboards and reports, or choose to easily create your own, SEI ensures that you’re equipped with everything you need for analyzing your enterprise’s CRM activities, including leads, opportunities, campaigns and multi-campaigns. With minimal set-up required, boosting your enterprise’s performance begins the day you make the decision to work more efficiently with SEI’s streamlined process for accessing, gathering, consolidating, and organizing data. Hit the ground running today with the financial information you need at your fingertips! |
Available For
|
||||||
Dashboards

Opportunity Overview

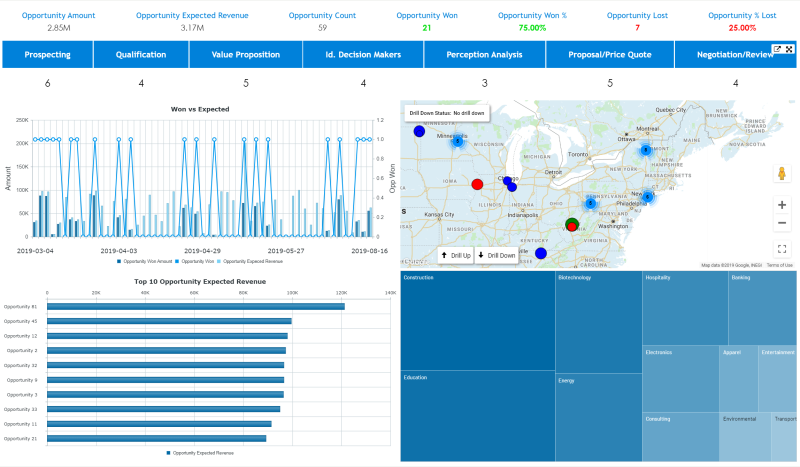
SummaryThe Opportunity Overview dashboard provides key information on the status of prospective clients. AudienceVP of Sales Sales Manager Sales Rep Features
|
Opportunity Pipeline

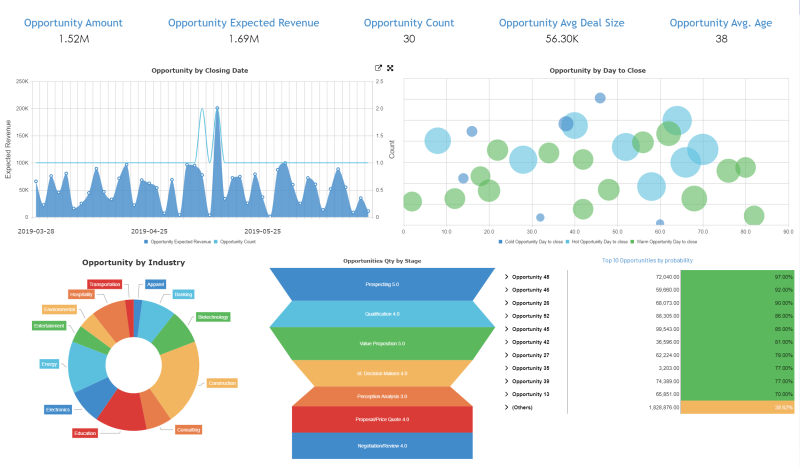
SummaryThe Opportunity Pipeline dashboard displays a comprehensive overview of sales opportunities for the following three months, including a breakdown by industry type, quantities by stage, opportunities by closing date, and percentages to quickly identify top prospects. AudienceVP of Sales Sales Manager Features
|
Marketing Campaign

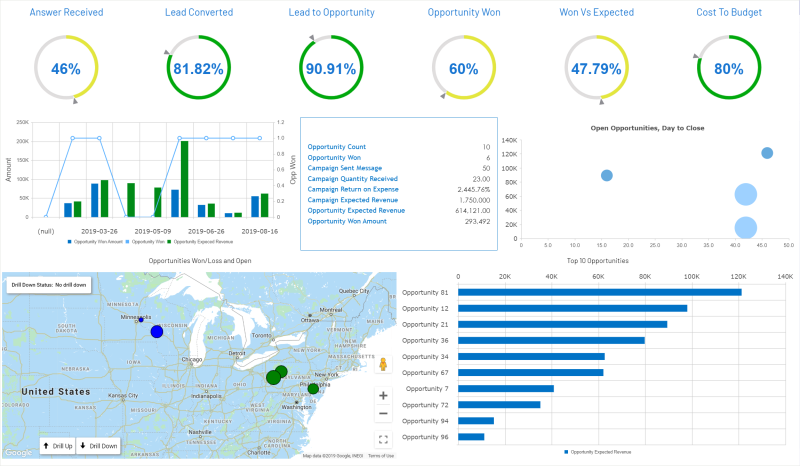
SummaryThe Marketing Campaign dashboard gives actionable insights into the effectiveness of a marketing campaign. Establish how many leads were won and where, view key opportunities, and keep track of revenue to plan ahead. AudienceVP of Sales Sales Manager Sales Rep Features
|
Top 10 Campaigns

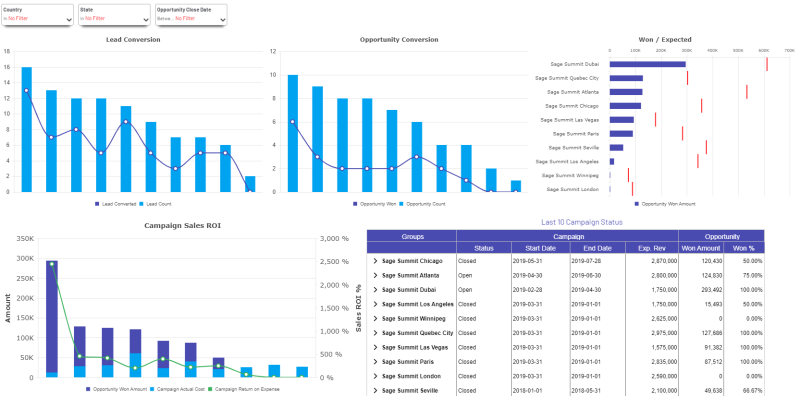
SummaryThe Top 10 Campaigns dashboard provides an overview of the 10 most successful campaigns. It displays profitability, lead conversion, Campaign ROI and campaign status for each individual campaign. AudienceVP of Sales Sales Manager Sales Rep Features
|
Key Performance Indicators

Opportunities

Opportunities
Opportunity Expected RevenueAmount of money you expect to generate from the opportunities. |
Opportunity ProbabilityEstimated chance to close the opportunity. |
Won vs ExpectedRatio of the total amount of opportunity over the expected amount. Won Amount / Expected Amount |
Opportunity AmountTotal financial amount of all the opportunities. |
Opportunity Won AmountTotal Amount for all the opportunities that are closed and won. |
Opportunity Average Deal SizeAverage opportunity deal size. Expected Revenue / Count |
Opportunity CountNumber of opportunities. |
Opportunity Won %Ratio of won opportunities over the total closed opportunities. Won / (Won+Lost) |
Opportunity Average AgeAverage opportunity age. Close Date - Open Date |
Opportunities WonNumber of closed/won opportunities. |
Opportunities LostNumber of closed/lost opportunities. |
Opportunity Lost %Ratio of lost opportunities over the total closed opportunities. Lost / (Won+Lost) |
Opportunity Day to CloseNumber of days before expected closing date. Close date - Current Date |
Leads
Leads
Lead ConvertedQuantity of Leads converted to contacts. |
Lead CountQuantity of Leads that have or have not been converted. |
% ConvertedRate of lead conversion. Converted / Count |
Campaign

Campaign
Number of Campaign Messages SentNumber of emails sent to individuals targeted by the campaign. |
Campaign Budgeted CostAmount of money budgeted for the campaign. |
Campaign Answer Received %The campaign response rate. Answers / Sent |
Number of Campaign Messages ReceivedQuantity of replies received from previously sent emails. |
Campaign Answer Received %The campaign response rate. Answers / Sent |
Campaign Lead to OpportunityOpportunities generated by leads as a ratio. Opportunity Count / Lead Count |
Campaign Actual CostActual amount of money spent to run the campaign. |
Lead Converted %Number of leads that were converted to accounts due to campaign marketing efforts. Lead Converted / Lead Count |
Campaign Cost to BudgetRatio of actual cost to budgeted cost amount for a campaign. Actual Cost / Budget Amount |
Opportunities Count by StatusQuantity of opportunities that are still Open, Won or Lost. |
Multi-Campaign
Multi-Campaign
Campaign Opportunity ConversionCampaign opportunity conversion rate. |
Campaign Sales ROISales dollars generated by dollars of actual cost for campaign. |
Campaign Won / ExpectedRatio of won amount to expected amount for a campaign. Opportunity Won Amount / Campaign Expected Amount |


