Introduction
The Solution for Better BISage Enterprise Intelligence
Serving as a central hub for all data sources, SEI simplifies the process of accessing and collecting information, then turns that information into actionable insights for smarter business decisions. The Universal Sales Data Model presented throughout this document demonstrates the power of having access to well over 150 KPIs that follow sales business reporting standards. Whether you use the predefined dashboards and reports, or choose to easily create your own, SEI ensures that you’re equipped with everything you need for analyzing your enterprise’s sales activities, including actual and forecasted numbers, comprehensive customer analysis, and top product sellers and sales reps. With minimal set-up required, boosting your enterprise’s performance begins the day you make the decision to work more efficiently with SEI’s streamlined process for accessing, gathering, consolidating, and organizing data. Hit the ground running today with the sales information you need at your fingertips! |
Available For
|
||||||
Forecast Data Entry Model

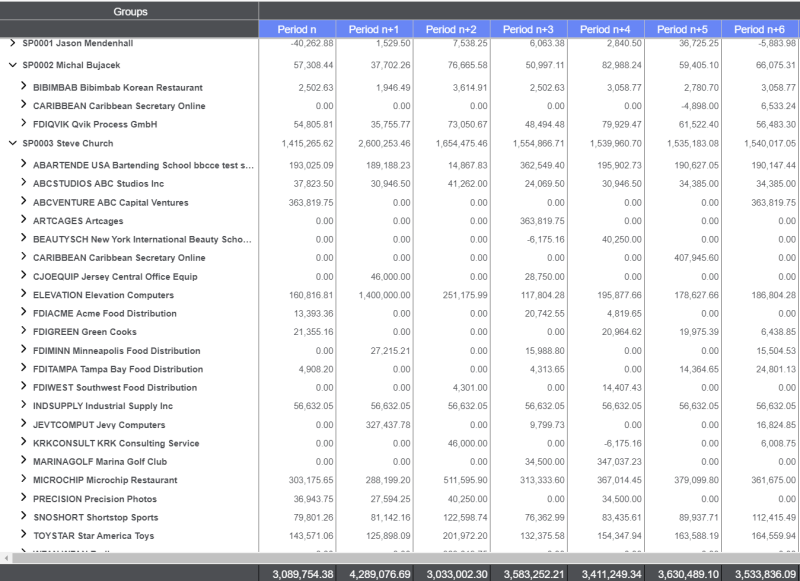
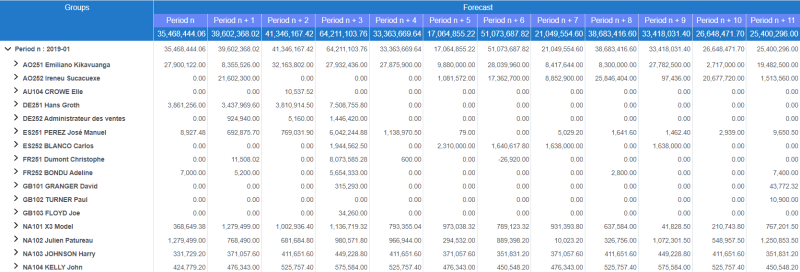
Fire Up Your ForecastingWith the Sales Forecast Data Entry Model, we’re delivering a forecasting module that allows sales forecast data entry, validation and analysis.
|
Dashboards

Sales Summarized

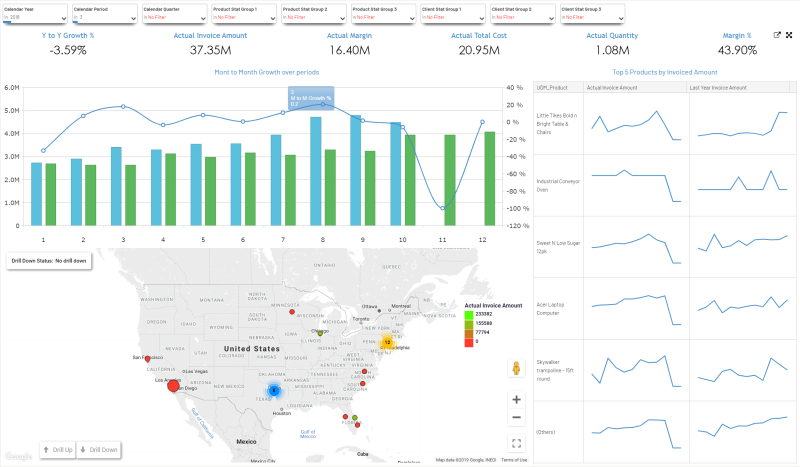
SummaryThe Sales Summarized dashboard provides a global view of company sales, with growth over time, total invoice amounts, margins, and top invoiced products. AudienceVP of Sales Sales Manager Sales Rep Features
|
Sales Performance

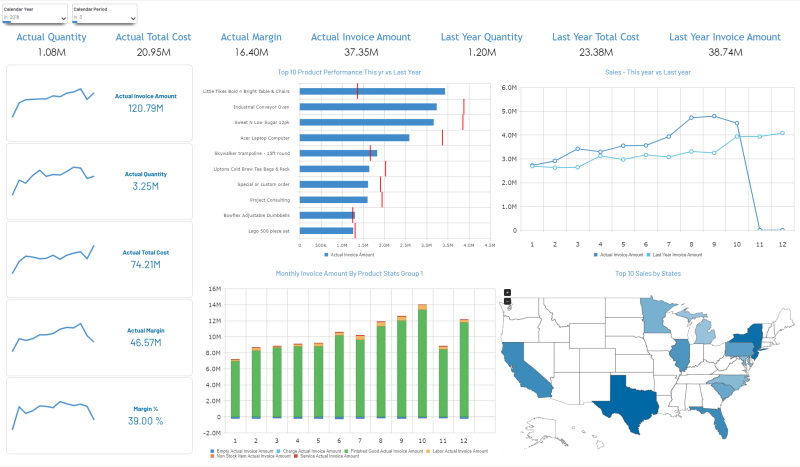
SummaryThe Sales Performance dashboard compares overall sales to previous months and years, shows top selling products, and where geographically these products are selling the most. AudienceVP of Sales Sales Manager Sales Rep Features
|
Sales Top Performers

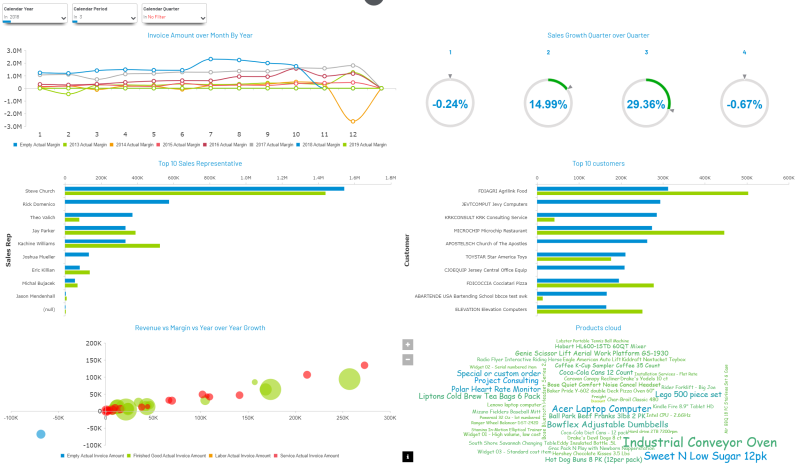
SummaryThe Sales Top Performers dashboard gives you insight into the company’s top sales reps, best customers, standout products, invoice amounts, revenue margin and sales growth. AudienceVP of Sales Sales Manager Sales Rep Features
|
Forecast Realization

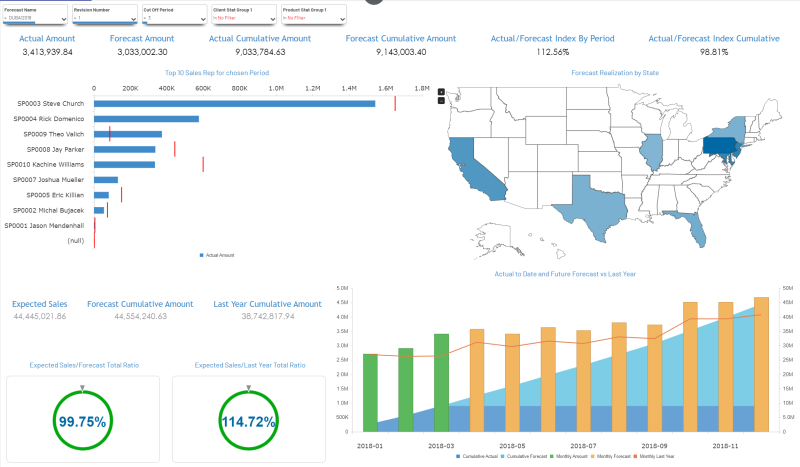
SummaryThe Forecast Realization dashboard provides a clear view of sales expectations, showing top sales performers, forecast by state, expected sales and forecast ratios, and comparisons of previous and future forecasts. AudienceVP of Sales Sales Manager Features
|
Forecast Performance

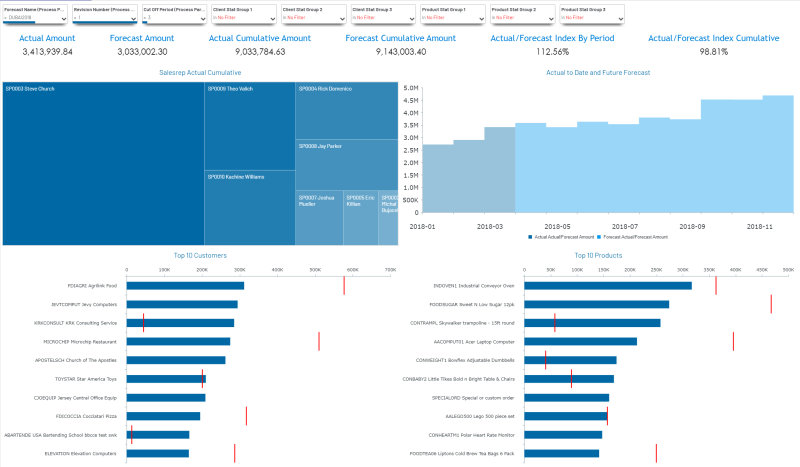
SummaryThe Forecast Performance dashboard compares the real sales numbers against what was forecasted, to assess the accuracy of the predicted numbers and provide a baseline for more refined future assessments. AudienceVP of Sales Sales Manager Sales Rep Features
|
Customer Order Analysis

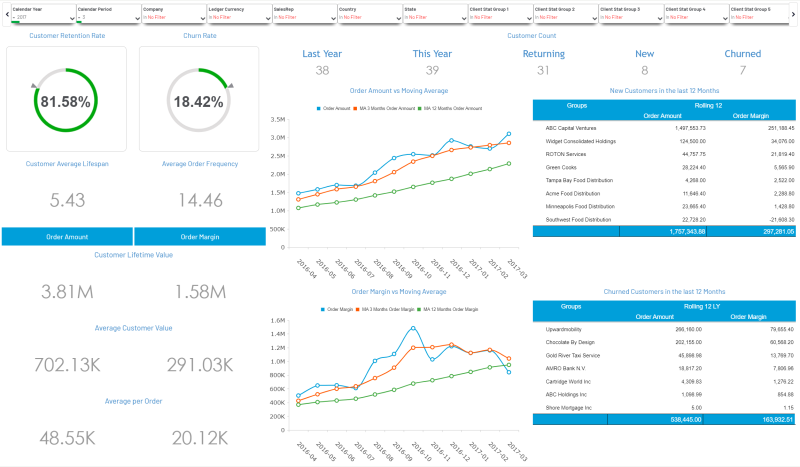
SummaryThe Customer Order Analysis dashboard displays key numbers on customer including count, retention rate, lifespan, new customers, customer churn, and order amounts and margins versus averages. AudienceVP of Sales Sales Manager Sales Rep Features
|
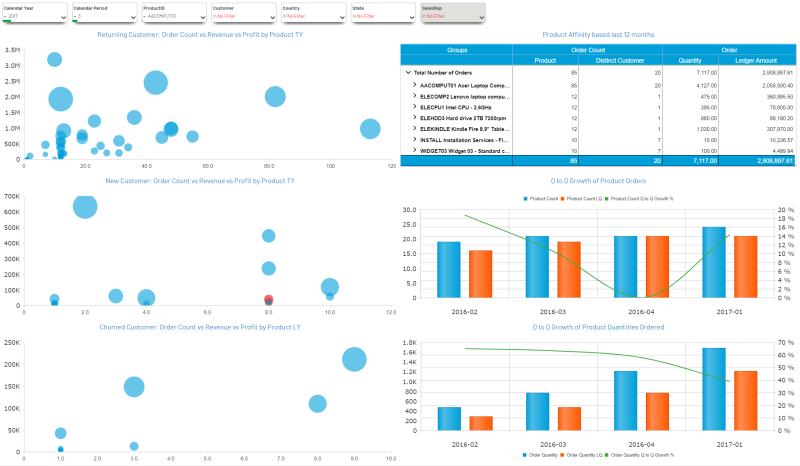
Customer Purchase Analysis

SummaryThe Customer Purchase Analysis dashboard reveals important insights based on customer purchasing habits, including best-selling products, what products are frequently bought together, and product sales growth. AudienceVP of Sales Sales Manager Sales Rep Features
|
Key Performance Indicators

Actual and Forecast

Actual and Forecast
Actual Cumulative AmountTotal of Actual Amount from First Period to Chosen Period. Total of Actual Amount from First Period of Forecast to Chosen Period |
Actual Cumulative Quantity LYTotal of Actual Quantity LY from First Period to Chosen Period. |
Forecast Cumulative AmountForecast Amount entered and validated in the forecast data entry module of SEI from First Period of Forecast to Chosen Period. |
Ratio Expected SalesBlended actual sales ratio over the original forecast. Expected Sales / Forecast Total |
Cumulative Forecast % AchievementRatio to compare to Forecast to see how well did we do against Forecasted Amount up until now. Actual Cumulative / Forecast Cumulative |
Actual Cumulative QuantityTotal of Actual Quantity from First Period to Chosen Period. Total of Actual Quantity LY from First Period of Forecast to Chosen Period |
Forecast AmountForecast Amount entered and validated in the forecast data entry module of SEI. |
Forecast Cumulative QuantityForecast Quantity entered and validated in the forecast data entry module of SEI from First Period of Forecast to Chosen Period |
Ratio Expected Sales Last YearBlended actual sales ratio over the last year actuals. Expected Sales / Forecast Total LY |
Forecast LY % AchievementRatio to compare to Forecast to see how well did we do against Forecasted Amount For last year. Actual LY / Forecast LY |
Actual Cumulative Amount LYTotal of Actual Amount LY from First Period to Chosen Period. |
Forecast QuantityForecast Quantity entered and validated in the forecast data entry module of SEI. |
Expected SalesSum of Actuals until Chosen Period plus Forecasts for remaining period of forecast. |
Forecast % AchievementRatio to compare to Forecast against Forecasted Amount to assess performance. Actual / Forecast |
Cumulative Forecast LY %Achievement Ratio to compare to Forecast to see how well did we do against Forecasted Amount up until now for Last Year. Actual Cumulative LY / Forecast Cumulative LY |
Customer Analysis

Customer Analysis
This Year Customer CountNote that Last Year is rolling, so it occurs between Chosen Period -12 and Chosen Period - 23 |
New CustomersNumber of Customer that ordered this year but not last year. |
Customer Retention RateRate of Customer that came back in the last 12 months but that purchased in the last 24 months. Returning Customer / Customer Count Last Year |
Order Amount Average Per OrderAverage Amount by Order. Order Amounts / Total Number of Orders |
Margin Average Per OrderWill give you the average margin per order. Total Sales Margin (Profit) / Total Number of Orders |
Last Year Customer CountNote that This Year is rolling so it occurs between Chosen Period and Chosen Period - 11. |
Churned CustomerNumber of Customer that ordered last year but not this year. Last Year - Returning |
Customer Average LifespanAverage number of years that a customer will return for. 1 / Customer Churn Rate |
Order Amount Avg Customer ValueAverage Order Amount per Customer for the last 12 Months. Average per Order (Revenue) x Average Frequency Order |
Average Customer Value MarginAverage Margin Amount per Customer for the last 12 Months. Average per Order (Profit) x Average Frequency Order |
Returning CustomersNumber of Customers that were retained. |
Customer Churn Rate or Attrition RateRate of Customer that didn’t come back in the last 12 months but that purchased in the last 24 months. Churned Customer / Customer Count Last Year |
Order FrequencyAverage Number of Orders by Customer in the last 12 months. Order Count / Total Customer |
Order Amount Cust. Lifetime ValueExpected Customer Order Amount (Revenue) for their expected entire Lifetime as a customer. Average Customer Value (Revenue) x Average Customer Lifespan |
Customer Lifetime Value MarginExpected Customer Order Margin (Profit) for his expected entire Lifetime as a customer Average Customer Value (Profit) x Average Customer Lifespan |
Sales Matrix

| This Month | Last Month | Last Quarter | Last Year | Month to Month Growth % | Quarter to Quarter Growth % | Year to Year Growth % | Rolling 3 Months | Rolling 12 Months | Year To Date | Rolling 12 Last Year | Moving Average 12 Months | Moving Average 3 Months | |
|---|---|---|---|---|---|---|---|---|---|---|---|---|---|
| Order Amount | X | X | X | X | X | X | X | X | X | X | X | X | X |
| Order Cost | X | X | X | X | X | X | X | X | X | X | X | X | X |
| Order Margin | X | X | X | X | X | X | X | X | X | X | X | X | X |
| Order Margin % | X | X | X | X | X | X | X | X | |||||
| Order Quantity | X | X | X | X | X | X | X | X | X | X | X | X | X |
| Number of Orders | X | X | X | X | X | X | X | X | X | X | X | ||
| Product Count | X | X | X | X | X | X | X | X | X | X | X | ||
| Invoice Amount | X | X | X | X | X | X | X | X | X | X | X | X | X |
| Invoice Quantity | X | X | X | X | X | X | X | X | X | X | X | X | X |
| Invoice Cost | X | X | X | X | X | X | X | X | X | X | X | X | X |
| Invoice Margin | X | X | X | X | X | X | X | X | X | X | X | X | X |
| Invoice Margin % | X | X | X | X | X | X | X | X |


